Cracking the Code: Lottery Probability Fundamentals

Ever wonder what "1 in 45 million" really signifies? It's the core of lottery probability, going beyond marketing hype to reveal the actual chances involved. Understanding these fundamentals allows for a clearer perspective on the mathematical realities of the lottery.
Odds Vs. Probability: A Crucial Distinction
While often used interchangeably, odds and probability are distinct. Probability is the chance of a specific outcome divided by all possible outcomes. For instance, flipping a coin yields a 1/2 probability for heads (one desired outcome out of two possibilities).
Odds, however, represent the ratio of favorable to unfavorable outcomes. A coin flip presents 1:1 odds for heads (one favorable vs. one unfavorable). This difference is key when analyzing lotteries.
Decoding the UK National Lottery
The UK National Lottery offers a prime example of calculating lottery odds. Matching six main numbers from 59 is the path to the jackpot. This involves combinatorics, the mathematics of combinations.
Calculating the odds involves determining the number of possible combinations. The probability of winning the UK National Lottery jackpot is about 1 in 45 million, calculated as ({59 \choose 6} = 45,057,474).
Winning smaller prizes is much more likely. Matching three numbers offers roughly 1 in 96 odds, while four numbers jumps to about 1 in 2,180.
The UK National Lottery debuted on November 19, 1994. Odds have shifted due to changes in the number of balls. Until October 2015, choosing 6 of 49 balls resulted in a jackpot probability of around 1 in 13.98 million. Learn more about these odds and their history here. This historical context adds valuable perspective.
Why Understanding Probability Matters
Understanding lottery probability isn't a winning formula, but a tool for informed play. Grasping the true odds empowers more realistic decisions about lottery participation. It helps avoid common misconceptions and fosters a balanced perspective.
Master the Formula: Calculating Any Lottery's True Odds

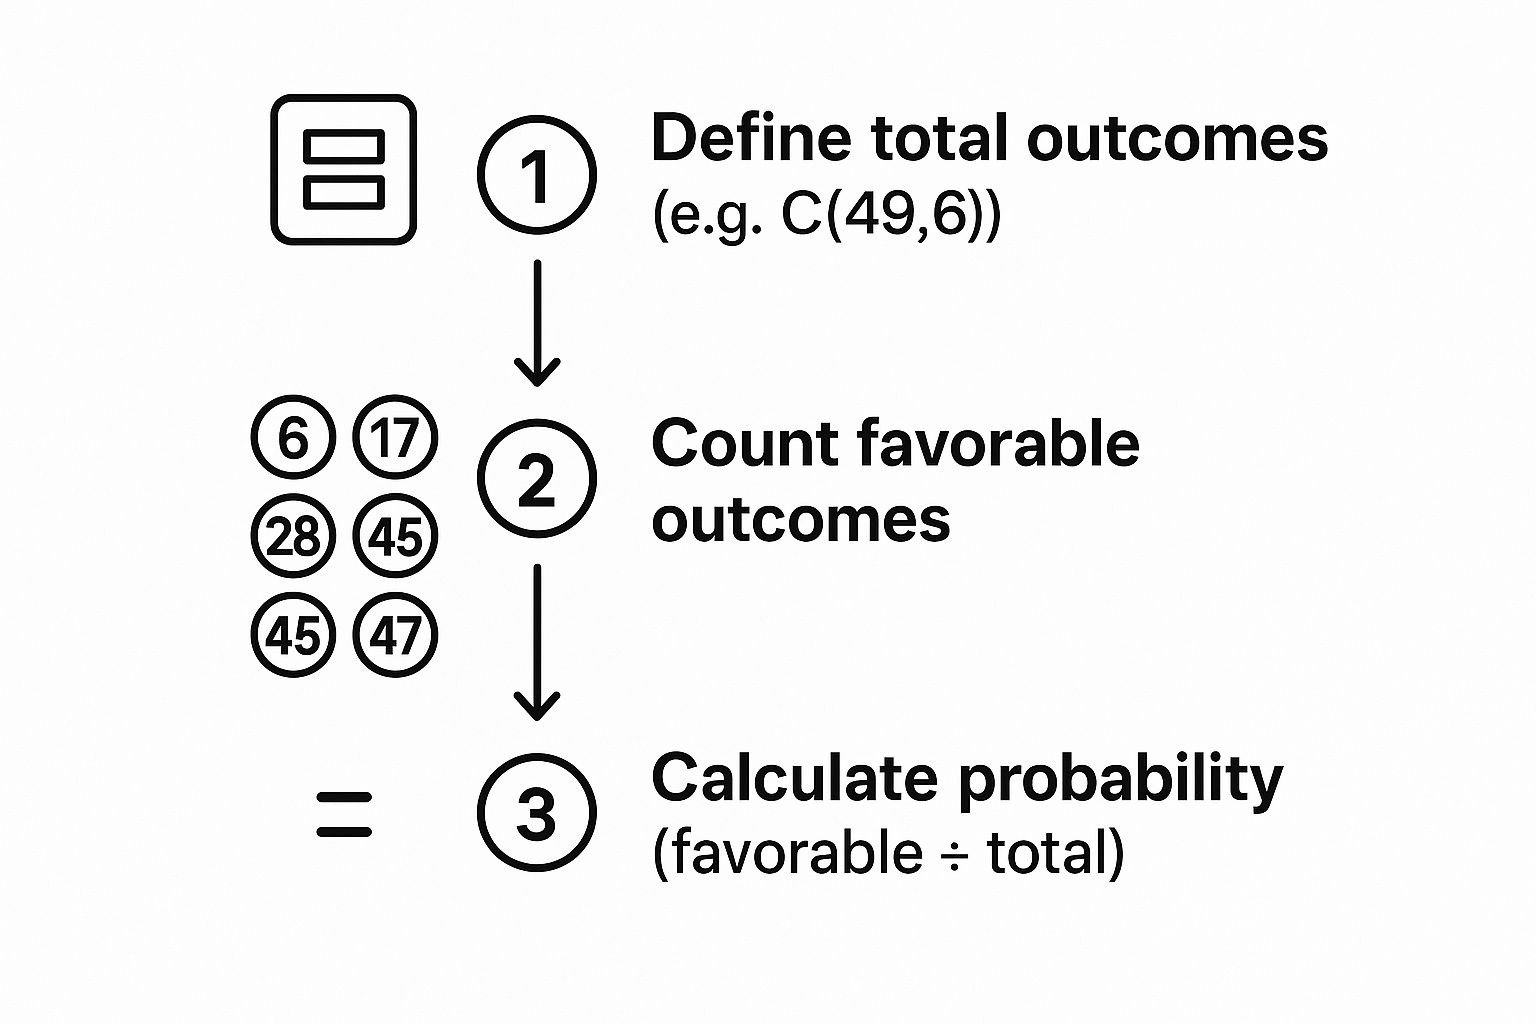
This infographic neatly summarizes how to calculate lottery odds. It breaks the process down into three key steps: defining all possible outcomes, identifying favorable outcomes, and calculating the probability. By understanding this visual representation, you'll be well-equipped to tackle lottery odds calculations on your own.
Forget relying on external sources – you can calculate the odds yourself! This knowledge empowers you to make informed choices about which lotteries to play and how much to spend. Let's break down the combination formula: n!/(r!(n-r)!). Here, n represents the total number of balls, and r represents the number of balls you choose.
Understanding the Formula
This formula, commonly known as the combination formula, calculates the number of ways to choose a group of items from a larger set. In the context of the lottery, it tells us how many ways you can choose your numbers. For instance, in the UK Lotto, you choose 6 numbers from 59. Therefore, n = 59 and r = 6.
The factorial symbol (!) means multiplying a number by every whole number below it. For example, 5! is 5 * 4 * 3 * 2 * 1 = 120. Most calculators have a factorial function to simplify this process.
Practical Application: The UK Lotto
Let’s apply the formula to the UK Lotto. We calculate the total possible combinations by computing 59! / (6! * 53!). This simplifies to the impressive number of 45,057,474 – the total possible combinations of 6 numbers drawn from 59. With only one winning combination, your odds of winning the jackpot are 1 in 45,057,474.
Simplifying with a Calculator
Many calculators feature a combination function (often labeled as nCr). This function simplifies the calculation considerably. By entering 59 nCr 6, your calculator will instantly display the 45,057,474 total combinations. This shortcut works for any lottery using the combination format. Interested in other lottery calculations? Check out this resource: How to master Lucky 15 calculations.
Applying the Formula to Other Games
This same method can be applied to other lottery games. Take the Thunderball, for example. You choose 5 main numbers from 39 and 1 Thunderball from 14. Calculate the combinations for the main balls (39 nCr 5) and multiply it by the Thunderball combinations (14 nCr 1). This will give you the overall odds of winning the Thunderball jackpot. For those interested in understanding audience engagement, resources like Twitter Engagement Rate Fundamentals can be helpful. By mastering this formula, you have the tools to analyze any lottery's odds.
To illustrate the different odds across UK lottery games, let's look at the following table:
UK Lottery Games Odds Comparison
| Lottery Game | Format | Jackpot Odds | Any Prize Odds |
|---|---|---|---|
| UK Lotto | 6 numbers from 59 | 1 in 45,057,474 | (Data not provided in the original text, requires research) |
| Thunderball | 5 numbers from 39 + 1 from 14 | (Requires calculation as described in the text) | (Data not provided in the original text, requires research) |
This table provides a clear comparison of the odds of winning the jackpot in both the UK Lotto and Thunderball. As you can see, the odds vary depending on the game's format. Understanding these differences is essential for making informed decisions about which lotteries to play.
Evolution of the Odds: How UK Lotteries Have Changed

The UK National Lottery, a favorite pastime for many, has a rich history. It's evolved significantly over the years, changing how we calculate lottery odds and the chances of winning. Let's explore this fascinating journey, highlighting the interplay between game design, player psychology, and the elusive odds.
The 49-Ball Era
For years, the UK National Lottery consisted of choosing 6 numbers from a pool of 49. This meant the odds of winning the jackpot were about 1 in 13.98 million. While still a long shot, these odds were significantly lower than today's. This era fostered a sense of possibility, shaping how players viewed their chances.
Shifting the Landscape: The Move to 59 Balls
October 2015 brought a major change. The number of balls increased from 49 to 59, drastically altering the odds calculation. This seemingly small adjustment had a huge impact, pushing the jackpot odds to roughly 1 in 45.057 million. This shift aimed to generate larger, more enticing jackpots and boost the thrill of rollovers. You can find more detailed statistics here. Understanding probabilities in different contexts can be helpful. For instance, investors might want to know how to calculate stock correlation.
Impact on Jackpots and Player Behaviour
This change had a ripple effect. Jackpots grew larger and rolled over more frequently because winning became less likely. This created a cycle of anticipation and excitement, attracting more players despite the reduced chances. It reveals how lottery operators carefully balance the probability of winning with the temptation of a life-changing prize.
Adapting to the Changes: Strategic Considerations
Understanding the history of the UK National Lottery allows players to adjust their strategies and manage expectations. Knowing the historical context of the odds gives a valuable perspective on today’s game. This knowledge helps players approach the lottery with a more informed viewpoint, balancing the mathematical realities with the game's excitement.
Best Odds in the Game: Comparing Lottery Probabilities

Not all lottery tickets are created equal. Some offer significantly better chances of winning than others. This section explores the odds of various UK and international lotteries, helping you understand where your money might offer the best mathematical value.
Jackpot Odds: A Comparative Look
One crucial element to consider is the odds-to-jackpot ratio. The UK National Lottery presents a tempting jackpot, but the odds of winning are roughly 1 in 45 million. Other lotteries, such as the EuroMillions, offer even longer odds, often coupled with potentially larger jackpots. This balance between the size of the jackpot and the likelihood of winning is a key factor in your decision-making.
Some smaller lotteries may provide better odds of winning their (smaller) jackpots. However, a smaller jackpot might not be as enticing, even with the improved odds.
This raises an important strategic question: are you aiming for the ultimate dream, or hoping for more achievable wins?
Beyond the Jackpot: Secondary Prize Tiers
Many lotteries offer secondary prize tiers, increasing your overall chances of winning something. Matching fewer numbers in the UK Lotto still results in a prize, although a considerably smaller one. Understanding the probability of these secondary wins provides a more complete understanding of a lottery's potential value.
Some lotteries incorporate extra features like bonus balls or supplementary draws. These features can significantly impact your odds. They frequently add extra prize tiers, boosting your winning chances but also adding complexity to calculating the odds. For instance, the Thunderball, with its smaller number pool, offers notably better odds than the main Lotto draw.
Comparing Apples to Apples: Price vs. Probability
Ticket price also plays a crucial role. A cheaper ticket may seem more appealing initially. However, if the winning odds are proportionally lower, its value might be less than a more expensive ticket with better odds. Analyzing the connection between ticket price and probability is essential for making informed decisions.
To illustrate this, consider the simplified example below:
Let's delve into the probabilities associated with different prize tiers in the UK National Lottery. The following table, "Prize Tier Probability Breakdown," presents a detailed overview of the matching requirements, probability, and odds for each tier. This information can help you better understand the chances of winning various prizes.
| Prize Tier | Matching Requirements | Probability | Odds (1 in X) |
|---|---|---|---|
| Jackpot | 6 Numbers | 0.000000022196 | 45,057,474 |
| 5 Numbers + Bonus Ball | 5 Numbers + Bonus | 0.00000073987 | 1,351,459.6 |
| 5 Numbers | 5 Numbers | 0.000018497 | 54,061.6 |
| 4 Numbers | 4 Numbers | 0.00096861 | 1,032.4 |
| 3 Numbers | 3 Numbers | 0.014441 | 69.23 |
| 2 Numbers | 2 Numbers | 0.10299 | 9.708 |
The table above clearly demonstrates how the probability of winning varies drastically across the different prize tiers. While the jackpot offers a life-changing sum, the odds are incredibly slim. However, the odds of winning smaller prizes, like matching 2 or 3 numbers, are considerably better.
Analyzing the "Prize Tier Probability Breakdown" reveals the importance of managing expectations. While the jackpot remains the ultimate goal, understanding the odds of winning at different levels provides a more realistic perspective on your chances. This knowledge empowers you to make informed decisions about your lottery budget and play style.
Lottery Myths Debunked: What Actually Affects Your Odds
The lottery, a captivating game of chance, often sparks dreams of instant riches. However, despite the allure of a life-changing win, it's essential to approach the lottery with a clear understanding of probability. Numerous myths and misconceptions surround lottery odds, often leading players astray. Let's debunk some of the most prevalent falsehoods and explore the reality of lottery chances.
The Myth of Hot and Cold Numbers
Many lottery players believe in the concept of "hot" and "cold" numbers. The idea is that numbers drawn frequently are "hot" and thus more likely to reappear, while less frequent numbers are "cold" and less likely to be drawn. This is a fallacy. Each lottery draw is an independent event, meaning past results have no bearing on future draws. The probability of any single number being drawn remains constant, regardless of its history. Choosing "hot" numbers offers no statistical advantage over randomly selected numbers.
Syndicate Play: More Chances, Not Better Odds
Joining a syndicate involves pooling money with others to purchase more tickets. While this increases your chances of winning any prize, it doesn't improve the odds of winning the jackpot on a per-ticket basis. For instance, a syndicate buying 100 tickets still faces the same odds (let's say, 1 in 45 million) for each individual ticket. They simply have 100 attempts at those odds. This can improve the potential return if a smaller prize is won and shared, but the jackpot odds remain unchanged. You might find this interesting: Exploring different instant win competitions.
Complex Systems: A Misguided Approach
Elaborate number-picking systems often claim to unlock the secrets of the lottery. However, these systems are mathematically unfounded. While they may appear sophisticated, they don't influence the inherent randomness of the draw. Every number combination has an equal probability of being selected, regardless of perceived patterns or complexities.
Cognitive Biases: Understanding the Psychology of Lottery Myths
The persistence of lottery myths stems from cognitive biases, inherent flaws in human thinking. The gambler's fallacy, the belief that past events affect future random outcomes, fuels the belief in "hot" numbers. Confirmation bias, the tendency to favor information supporting pre-existing beliefs, reinforces ineffective strategies. Understanding these biases is crucial for making rational lottery decisions.
The Reality: What Does Affect Your Odds
The only true influencer of your lottery odds are the game's rules themselves. The number of balls drawn and the number you need to match dictate your chances. The more numbers you must match, the lower the probability of winning. This principle applies universally across all lottery games. Accepting this reality allows for a more informed and responsible approach to playing the lottery.
Making Sense of the Numbers: Visualizing Lottery Odds
It's tough to really grasp how immense lottery odds truly are. Numbers like "1 in 45 million" often seem abstract and distant. This section uses visualization and relatable examples to make these probabilities more concrete. You'll develop a better sense of what these odds represent and how to calculate lottery odds.
Thinking Beyond the Numbers: Relatable Comparisons
One way to visualize these odds is through comparisons. Picture a football stadium packed with 45 million ping pong balls. Only one has a red dot. Winning the lottery is like randomly picking that single red dot. This helps illustrate the vastness of 45 million and how slim the jackpot chances are.
Another example: imagine buying one lottery ticket weekly. Statistically, it could take roughly 865,385 years to win. This stark comparison really emphasizes the long-odds nature of lotteries.
Expected Value: Evaluating Your Lottery Investment
Expected value is key to understanding a lottery ticket's worth. This calculation factors in the potential prize and the probability of winning. As a simple illustration, consider a lottery with a £1 million jackpot and 1 in 10 million odds. A £1 ticket's expected value is just £0.10 (£1 million * 1/10,000,000). This means, on average, a £0.90 loss for every £1 spent.
This holds true for all lotteries, including the UK National Lottery. Expected value helps you determine a game's mathematical fairness and if the potential reward is worth the cost. This knowledge empowers you to make informed choices about how to calculate lottery odds and when playing the lottery might be a reasonable entertainment expense.
The Psychology of Risk Perception: Why We Play Despite the Odds
Despite the unfavorable odds, millions still play. This is due to how our minds process risk. We tend to overestimate small probabilities, making the lottery appear more attainable. Also, a ticket's low cost feels insignificant compared to a potentially life-changing win.
However, aligning expectations with statistical realities is essential for a healthy view of gambling. The visualizations and expected value calculations here aim to provide a framework for balancing the enjoyment of playing with the mathematical probabilities.
Beyond The Numbers: Smart Applications of Lottery Math
Understanding how to calculate lottery odds isn't just about crunching numbers; it's about making informed decisions about your gameplay. This knowledge empowers you to move beyond random chance and embrace a more strategic approach.
Expected Value: Identifying Favorable Conditions
One key application of lottery math is calculating the expected value. This concept helps you identify potentially favorable lottery conditions. Expected value considers both the potential prize and the probability of winning. For instance, rollover jackpots increase the potential payout, sometimes making the expected value higher than usual (though still statistically negative overall). You might be interested in exploring different instant win competitions.
Syndicate Play: Strength in Numbers?
Syndicates, groups of people pooling their money to buy more tickets, are a popular lottery strategy. While syndicates don't improve individual jackpot odds, they do increase the chances of winning smaller, shareable prizes. Lottery math helps determine the ideal syndicate size and contribution structure for maximizing returns while splitting costs.
Budgeting Wisely: Responsible Lottery Play
Probability principles also guide responsible lottery spending. Understanding lottery odds helps you establish a realistic budget aligned with your desired level of play and risk tolerance. This prevents overspending driven by unrealistic expectations, ensuring lottery play remains an affordable form of entertainment. It shifts vague hopes into concrete financial decisions.
Ready to explore some exciting opportunities? Visit Lucky Turbo Competitions for a chance to win amazing prizes.
